Paesi europei per potere d’acquisto nella regione – 2024
https://i.redd.it/oufrbrj6cede1.jpeg
di ilArmato

Paesi europei per potere d’acquisto nella regione – 2024
https://i.redd.it/oufrbrj6cede1.jpeg
di ilArmato
26 commenti
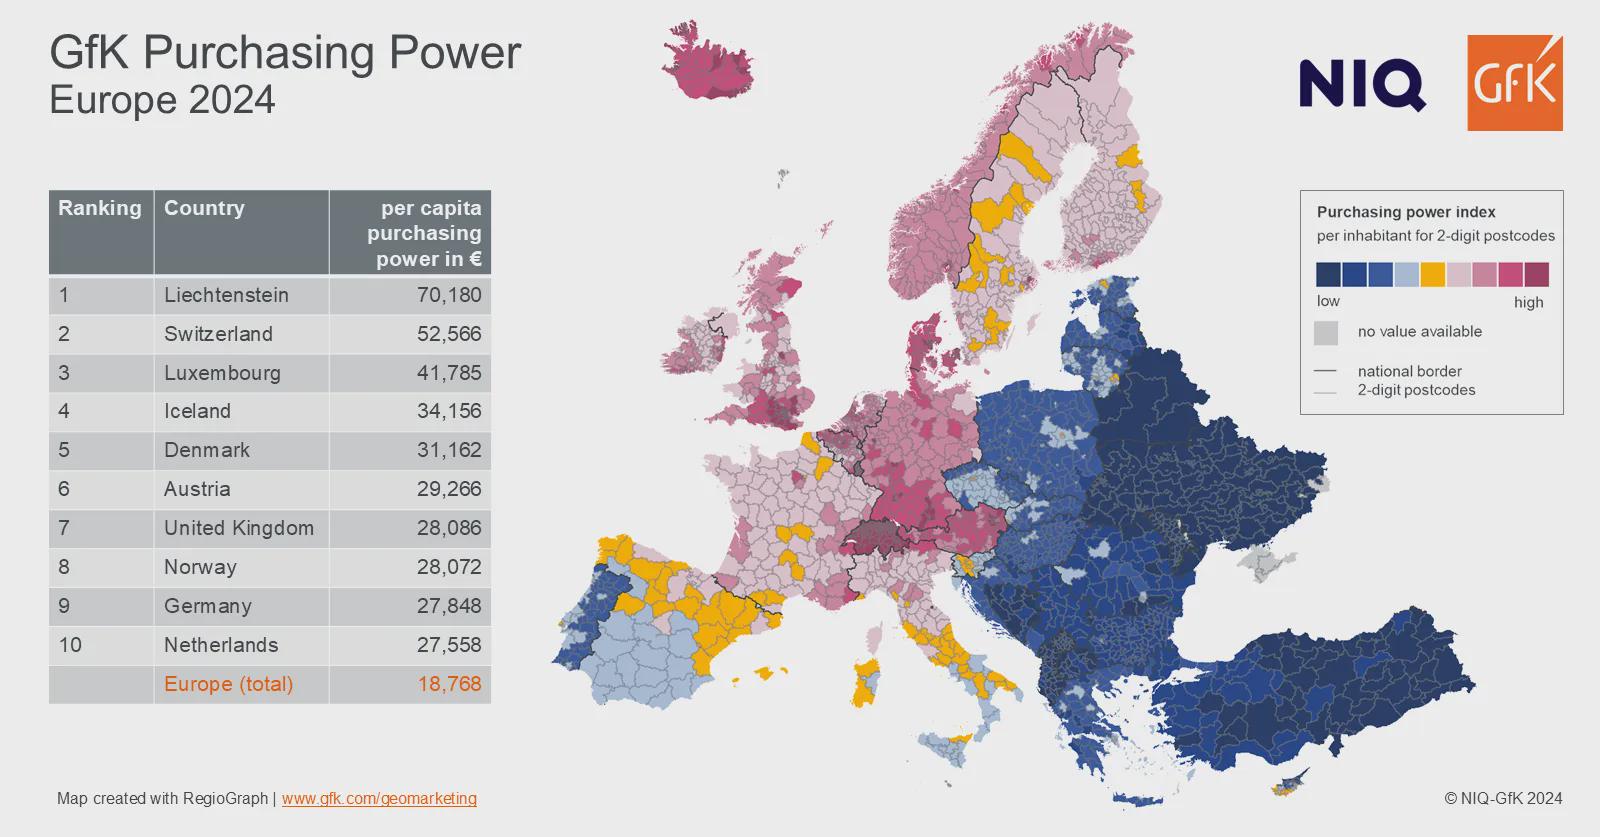
[Source](https://nielseniq.com/global/en/insights/infographic/2024/map-of-the-month-gfk-purchasing-power-europe-2024/)
> This year, the average per capita purchasing power in Europe rises to 18,768 euros. However, there are significant differences between the 42 countries: Liechtenstein is in first place with a spending potential of 70,180 euros per capita, while people in Switzerland and Luxembourg in second and third place still have 52,566 euros and 41,785 euros available for spending and saving. As in previous years, Ukraine brings up the rear. With a per capita purchasing power of 2,878 euros, Ukrainians are almost 85 percent below the European average.
Shocking! Top three are tax havens and glorified money launderettes
Portugal, the honorary eastern european country as usual.
r/PORTUGALCYKABLYAT
Left: Conquer, centralize, grow. Right: Defend, survive, catch up. Turkey is an exception, however – they took land after land and yet…
r/bocchitherock
Portugal can into Eastern Europe 💪
Ireland being #1 in GDP per capita but not even making the list when in comes to purchasing power…i don’t think that being a tax haven for US corpos works
How is it measured? I mean the prices in Poland are way lower than in the Western Europe…
More than 30 years after fall of USSR half of Europe still has to deal with the economic baggage.
Communism, not even once
how does norway have a lower purchasing power than most of germany
I always laugh when i see the Greek stats on this matter.
Get paid 1.8k declare the minimum wage.
Get paid 10k a month declare less than what you pay your employee 😅😅
The color choice triggers me
Austria is way richer than I thought… What are their economic spearheads?
Yea I don’t believe in UK statistics
Norway and Germany under the UK? I highly doubt that…..
Also where does Iceland get its money from?
This map looks bogus to me.
> Purchasing power is a measure of disposable income after the deduction of taxes and charitable contributions, and it also includes any received state benefits. The study indicates per-person, per-year purchasing power levels in euros and as an index. GfK Purchasing Power is based on the population’s nominal disposable income, which means values are not adjusted for inflation. Calculations are carried out on the basis of reported income and earnings, statistics on government benefits, as well as economic forecasts provided by economic institutes.
So it is a bad comparison, because for instance social benefits and pension provisions can be included in taxes in some countries, but have to be paid out of net salary in others.
This explains why countries like Norway and The Netherlands are below where you would expect them, and Belgium is not even in the top 10.
Looking at per capita GDP (PPP) shows quite a different, and from my perspective more realist picture: https://ec.europa.eu/eurostat/databrowser/view/sdg_10_10/default/table?lang=en
Love the contrast between Hungary and Austria
This seems nice as long you don’t travel too much. Slovenian going to Oslo may have some difficulties in getting drunk.
I dont think we’ll ever catch up to the west
Absolute bs.
Absolute bs i can’t afford shit here in Finland and i make over 80k year.
LIECHTENSTEIN ON TOP🔥🔥🗣🗣🇱🇮
You see that horizontal divide in Belgium? That shows up in every map too?
I wonder where Flanders would be on that list.
Whoever made this map could have easily replaced “high” and “low” with actual values that make sense.
I’m blue da-ba-dee da-ba-die
I thought blue was good