Can this country just get, a quick format? Because nothing seems to work.
Fishy_____Business on
I earn something like this in my country and I consider myself way wealthier than others.
nevim1234sk on
How is it calculated ? Is it cost of work, gross, net ? In some countries employer pays part of the social and health insurances.
Front-Anteater3776 on
With the prices on everything these days many still feel squeezed on an average salary.
Kakazam on
If Elon Musk sits in a stadium of 90000 people, the average net worth of the people inside is $9m.
This is why simple average salaries is poor way to measure actual income.
StarboardChaos on
Now adjust for purchasing power
Pleasethelions on
I see a lot of criticism and discussion on these maps.
But actually, it’s very easy to assess any map really quickly:
Denmark > Sweden: Accurate map, no problem.
Denmark < Sweden: Map is absolute BS and should be banned.
You’re welcome.
robeewankenobee on
Completely irelevant because the median income is so much more lower (Belgium here) … at 52k per year one would pay a ridiculous amount of taxes … somewhere north of 10k per year.
lincemiope on
Can we ban “average” from existence so that people start using “median”?
morbihann on
Average is so terrible.
Huge percentage of people receive well below it, very few receive enormously more.
meldirlobor on
Now show us wealth distribution, please.
ZerkerDE on
Those Statistics are mostly BS because the calculation is hard to be comparable
in Germany u get 50% net of the cost to your employer but Healthcare and a Pension which pays an amount nobody knows is included.
In other countries its all net except taxes but you have to pay Healthcare yourself and arguably save more for retirement.
dobik on
The biggest surprise for me is Lithuania. I always thought that Estonia is doing the best out of all Baltic states.
Fexofanatic on
average? get out of here. median is where it’s at (ignoring those pesky super-rich outliers)
Qwe5Cz on
It says nothing next to each other since there are different taxes, social, health insurance that is calculated different way in each country. Then cost of living matters. Median is better representation of those numbers. But still it only says how much money people see on their payroll – not how much money they get to their account and if it’s decent amount for good quality of living.
Stoic_cave on
I’m moving to Iceland , my uk salary isn’t anywhere near 51k €
Low_Technician7346 on
Those maps are bullshit
thazhok on
don’t know how to react seeing i live with half the average income of my country.
median income would be more accurate about the population
AIR_YT on
r/PORTUGALCYKABLYAT
Bubbly_Reaction8891 on
Seems far too high to me
Altruistic_Rush1204 on
Is this before or after taxes?
CSGOan on
In Sweden “arbetsgivaravgift” or employer contribution tax is added on top of the salary. This amounts to 31.42%, drastically lowering the apparent wage in Sweden compared to other countries. I am sure other countries have something similar. Just looking at this one could think that denmark is super rich, but it ain’t that rich.
Erander on
Gross or net?
Trang0ul on
After tax, right? Right?
Malacara112 on
En España estará en 15.000 al año
Moosplauze on
Purchasing power is the only valid metric for comparision imo.
actias_selene on
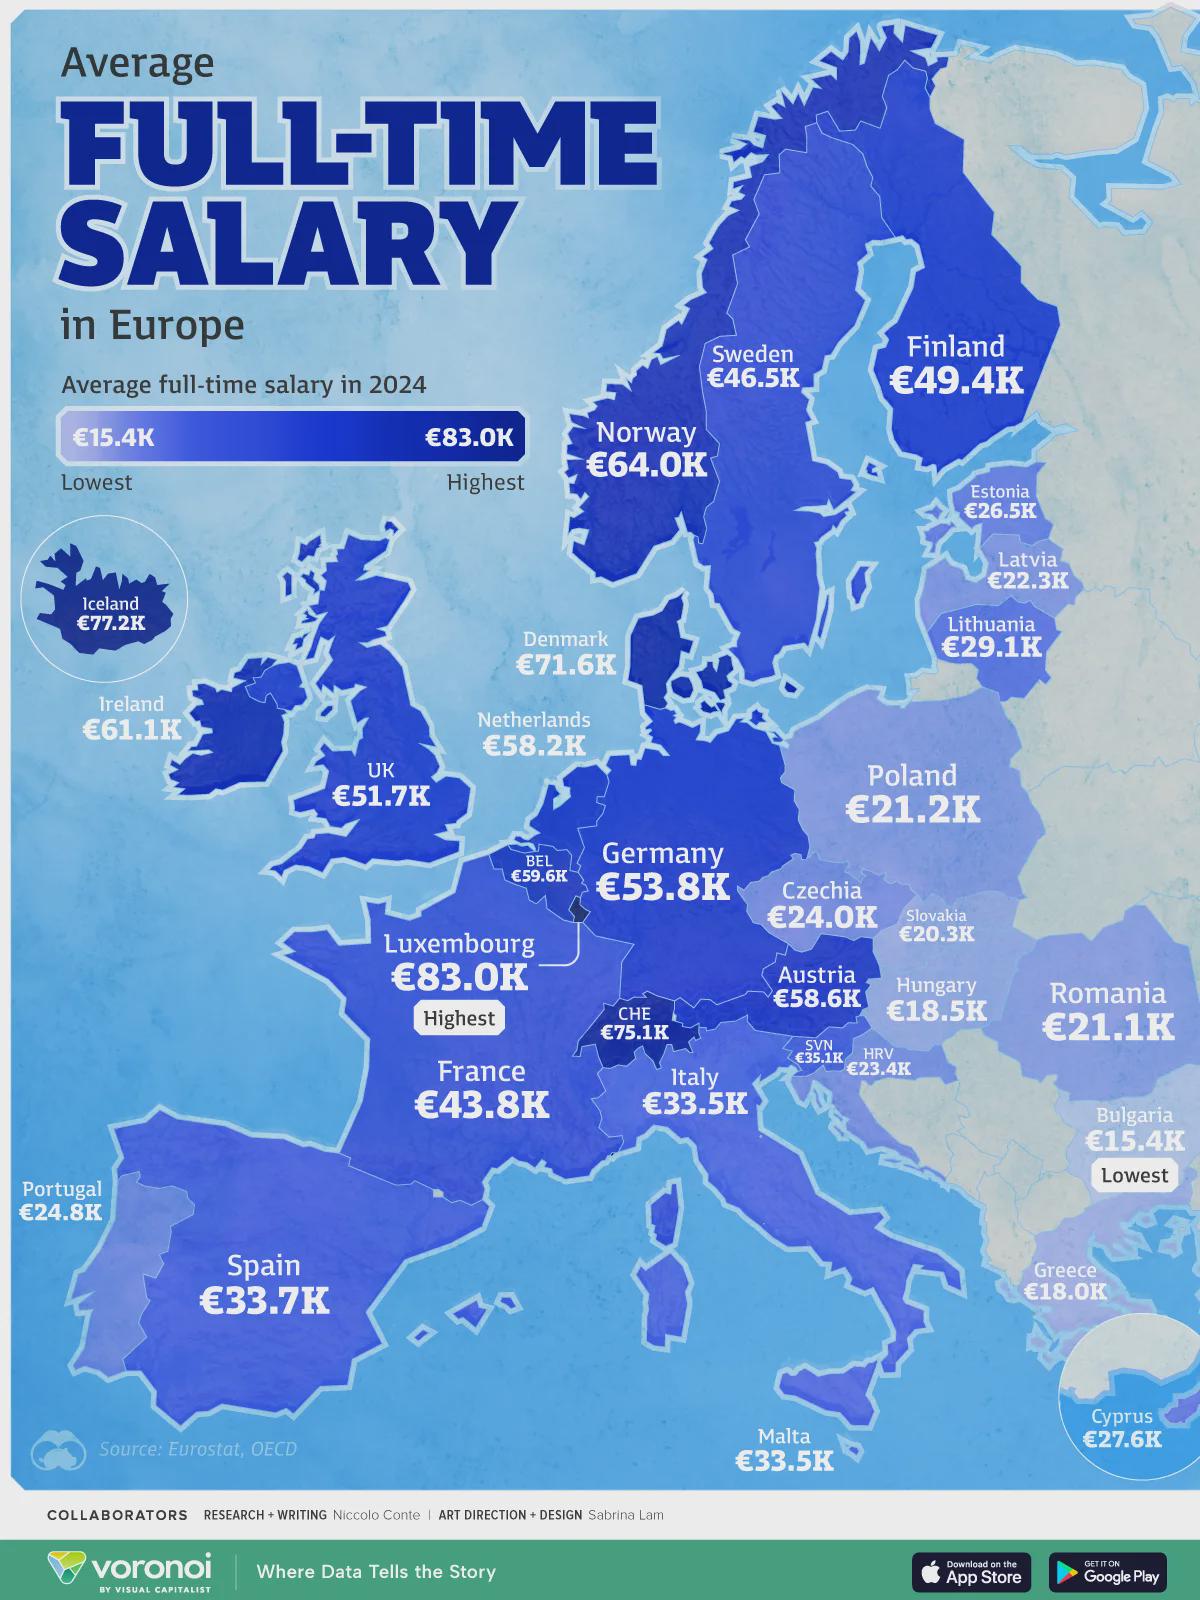
I wasn’t expecting Sweden to have less salary average than Germany and Austria.
timeforbed00 on
Romania’s gross in 2024 was ~20.800 EUR annually. Close but lower. Median gross was 16k, which is around 9000 euro annually… which seems accurate and realistic, 67% of the population gets less than the average… great success…
Unikanamnsuger on
These type of maps/graphs, while useful, do not show what most people think they show.
Considering they do not account for buying power, cost of living (energy, food etc), daycare costs, school cost, healthcare cost etc etc.
Its easy to look at lower income countries and summize that they’re doing much worse while in reality their actual QoL might be higher than the countries boasting a higher avg full time salary.
Also, as repeated over and over in here, average is most of the time a terrible metric, especially for this, shouldve been median.
LatelyPode on
What type of average is this? Looks like mean. Show the median so it isn’t distorted by lower population or really really rich outliers.
HopeSubstantial on
Average is extremely shitty measure.
In Finland median income is 33k/year or something.
Doctors and other extremely high sums earning people pull average up way more than low earning people can pull it down.

33 commenti
bullshit
Now show us the median income, please.
Second from bottom. Awesome.
Can this country just get, a quick format? Because nothing seems to work.
I earn something like this in my country and I consider myself way wealthier than others.
How is it calculated ? Is it cost of work, gross, net ? In some countries employer pays part of the social and health insurances.
With the prices on everything these days many still feel squeezed on an average salary.
If Elon Musk sits in a stadium of 90000 people, the average net worth of the people inside is $9m.
This is why simple average salaries is poor way to measure actual income.
Now adjust for purchasing power
I see a lot of criticism and discussion on these maps.
But actually, it’s very easy to assess any map really quickly:
Denmark > Sweden: Accurate map, no problem.
Denmark < Sweden: Map is absolute BS and should be banned.
You’re welcome.
Completely irelevant because the median income is so much more lower (Belgium here) … at 52k per year one would pay a ridiculous amount of taxes … somewhere north of 10k per year.
Can we ban “average” from existence so that people start using “median”?
Average is so terrible.
Huge percentage of people receive well below it, very few receive enormously more.
Now show us wealth distribution, please.
Those Statistics are mostly BS because the calculation is hard to be comparable
in Germany u get 50% net of the cost to your employer but Healthcare and a Pension which pays an amount nobody knows is included.
In other countries its all net except taxes but you have to pay Healthcare yourself and arguably save more for retirement.
The biggest surprise for me is Lithuania. I always thought that Estonia is doing the best out of all Baltic states.
average? get out of here. median is where it’s at (ignoring those pesky super-rich outliers)
It says nothing next to each other since there are different taxes, social, health insurance that is calculated different way in each country. Then cost of living matters. Median is better representation of those numbers. But still it only says how much money people see on their payroll – not how much money they get to their account and if it’s decent amount for good quality of living.
I’m moving to Iceland , my uk salary isn’t anywhere near 51k €
Those maps are bullshit
don’t know how to react seeing i live with half the average income of my country.
median income would be more accurate about the population
r/PORTUGALCYKABLYAT
Seems far too high to me
Is this before or after taxes?
In Sweden “arbetsgivaravgift” or employer contribution tax is added on top of the salary. This amounts to 31.42%, drastically lowering the apparent wage in Sweden compared to other countries. I am sure other countries have something similar. Just looking at this one could think that denmark is super rich, but it ain’t that rich.
Gross or net?
After tax, right? Right?
En España estará en 15.000 al año
Purchasing power is the only valid metric for comparision imo.
I wasn’t expecting Sweden to have less salary average than Germany and Austria.
Romania’s gross in 2024 was ~20.800 EUR annually. Close but lower. Median gross was 16k, which is around 9000 euro annually… which seems accurate and realistic, 67% of the population gets less than the average… great success…
These type of maps/graphs, while useful, do not show what most people think they show.
Considering they do not account for buying power, cost of living (energy, food etc), daycare costs, school cost, healthcare cost etc etc.
Its easy to look at lower income countries and summize that they’re doing much worse while in reality their actual QoL might be higher than the countries boasting a higher avg full time salary.
Also, as repeated over and over in here, average is most of the time a terrible metric, especially for this, shouldve been median.
What type of average is this? Looks like mean. Show the median so it isn’t distorted by lower population or really really rich outliers.
Average is extremely shitty measure.
In Finland median income is 33k/year or something.
Doctors and other extremely high sums earning people pull average up way more than low earning people can pull it down.