
Ciao reddit! Ho realizzato una mappa per esplorare visivamente il mercato degli affitti (e delle vendite) in Svizzera. Aggiornamento: ho aggiunto laghi, filtro per codice postale, zoom e un grafico temporale, mi piacerebbe il tuo feedback!
https://v.redd.it/6dkc9fbxnt3e1
di obolli
6 commenti
You didn’t link it? Am I missing something?
Link?
So I worked a little on it the past few evenings and last weekend and I tried to incorporate the feedback I got from you.
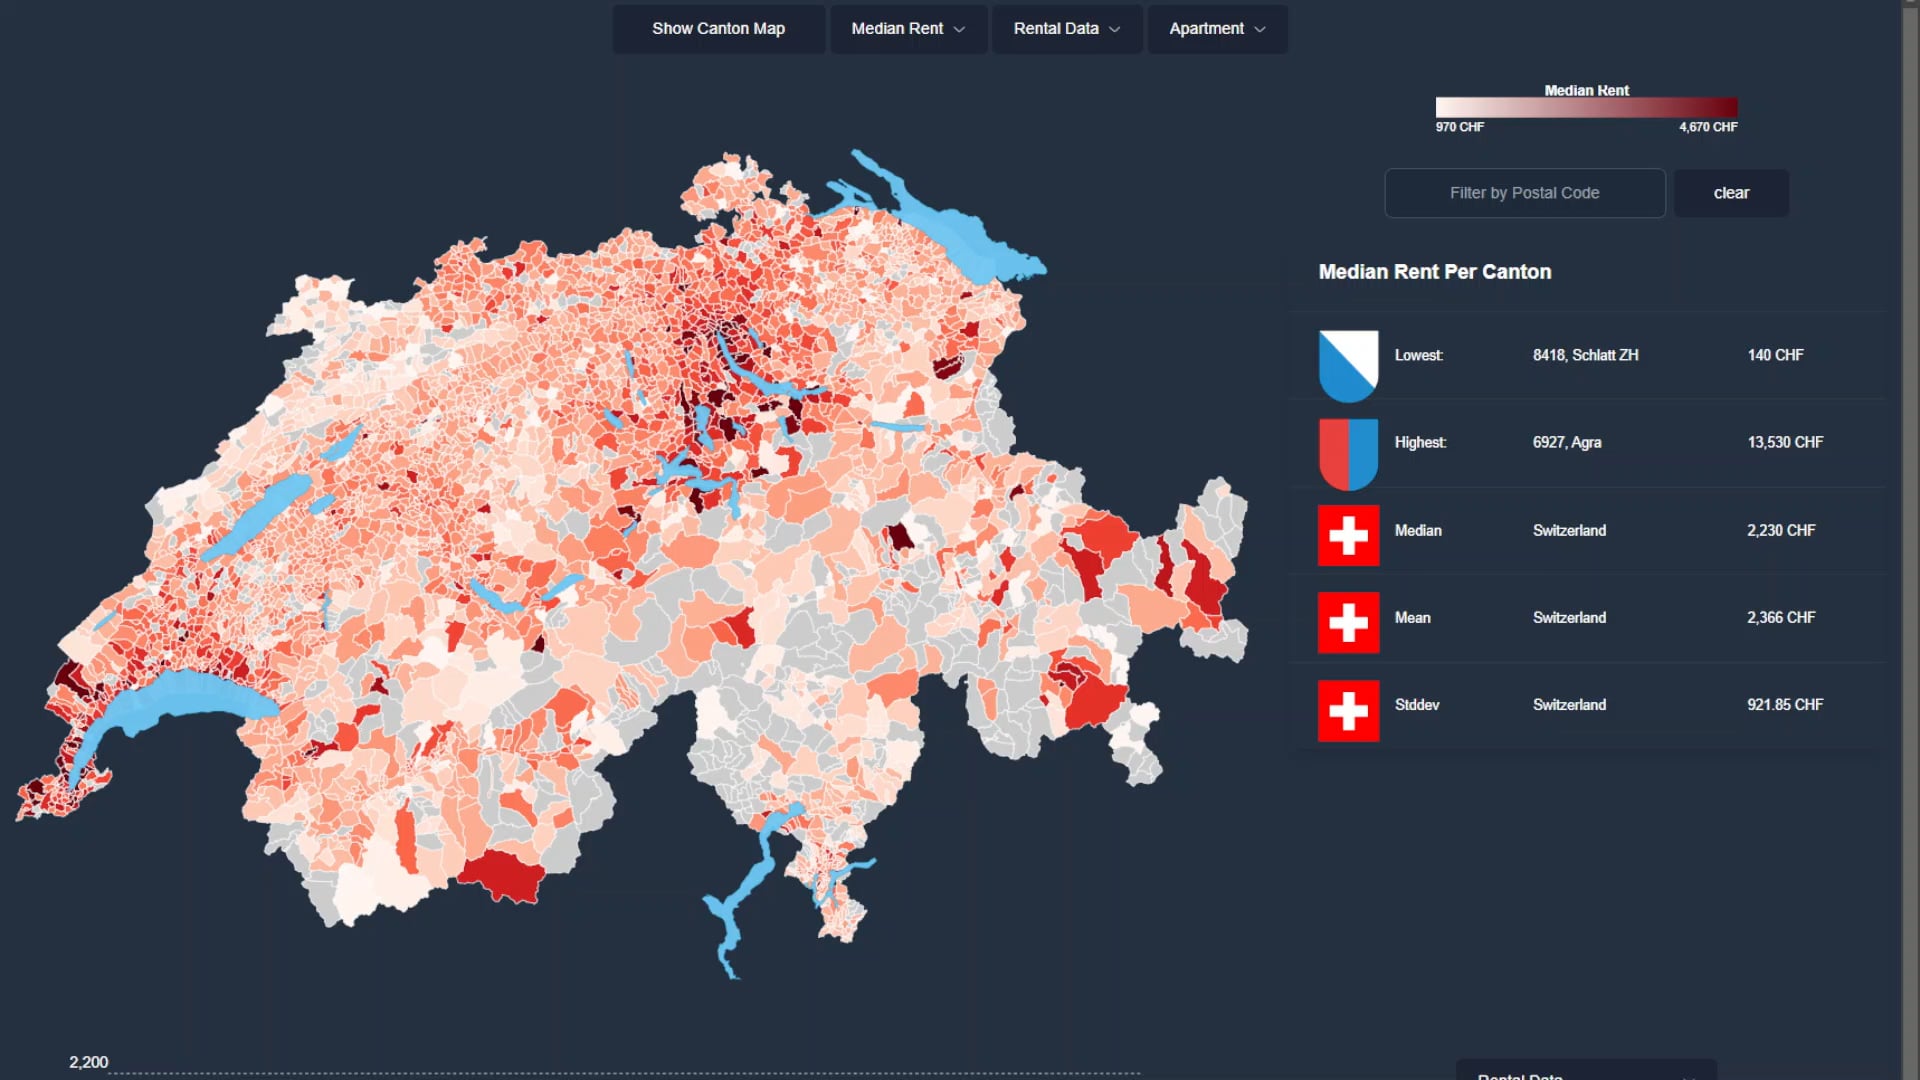
u/Top-Currency and so many others really wanted to see lakes. It took a while but I think it turned out ok. They are fairly transparent but I agree, it helps a lot. Thanks to u/flarp1 for pointing me to the right resources.
I added the filter to make sure the data is more understandable, i.e. Flats, Houses, Garages, Offices, Storages can be filtered out if you want.
There are still some outliers, like a huge parking lot near geneva that skews the average a little, I’ll convert the graphs to the median next.
A legend is now present, I’m still playing around with the color scale.
Zoom is back, I worked on it so it’s smoother to transition back to the normal size once you scroll out.
**Todo:**
* Mobile Version
* Population and Income data per Postcode/Canton
* Price increase map
* Filter by rooms i.e. 2, 2.5, 3, 3.5 rooms.
Which one of these would interest you the most? I would prioritize it for the next week. Is there anything again that you’d like to see? Lakes really helped a lot and it would have been something I wouldn’t have thought of myself.
What I found interesting is that houses did seem to get smaller over time, the price per sqm became migher. I will add this to the chart
If you’d like to try it it’s on [https://foxai.ch/](https://foxai.ch/) (probably temporary domain)
link?
Where is the Pfäffikersee?
Nice piece of work! Which lang did you use?